Hotel Conversion Rates Explained
When it comes to marketing your hotel on the internet, it’s natural to assume “the more people who see our website, the better”. As a general rule, this is a good thing. But if you’re collecting water into a leaky bucket, would you say the solution is to find (and often pay for) more water, or fix the bucket first?
Hotel content marketing, Google ads, organic social media marketing, paid social media marketing, search engine optimization and more all make it into your boutique hotel’s marketing plan. These methods all aim to increase traffic; to encourage more people to see your boutique hotel’s website.
Yet more often than not, there’s a glaring omission – does the website actually convert the people behind a screen to a guest who will spend money with your hotel?
In this post, I’ll run you through an explanation of what a hotel conversion rate is, how it can be calculated, and some benchmark numbers/industry averages.
Hotel Website Conversion Rates
First, a distinction. In this post, we are only interested in conversions that happen on your hotel’s website. While there is a lot to be said for measuring offline conversions that result from marketing your hotel on the internet, here we’re aiming to improve the powerful tool that is your website, saving you time and money rather than making reservations manually.
Think about your hotel’s success metrics when it comes to your website. If you’re tracking sessions, pageviews or users (visitors), chances are you may be getting caught up in the excitement of “all that data”. Will your hotel generate more revenue if your users are up 15%? Not necessarily.
Measuring website traffic without understanding conversion rates can misrepresent our success. So we can focus our digital marketing efforts on increasing our traffic to our website, or we can spend our time optimizing the same site to convert more users into making a booking.
Let’s say your website is visited by 1000 users per month and is currently converting 1% of these users to guests who stay at your hotel. Would you prefer:
- Doubling the users to 2000 per month, or
- Increasing your conversion rate to 2%?
On face value, it’s the same outcome, but consider the cost of the additional 1000 users. Did you pay for them to come from social media, or search?
By improving the conversion rate of your hotel website, you are getting better value out of your existing traffic. Better yet, if you improve your conversion rate earlier, you get better ROI (return on investment) of all future marketing efforts. Consider:
- Increasing your conversion rate to 2%, then
- Doubling your users to 2000 per month.
Instead of focusing your marketing efforts on bringing more and more traffic that may not convert, focusing on your hotel website conversion rate enables you to improve your performance over time. The reality is, if you can’t convert your traffic into hotel guests, your marketing is failing no matter how many users come to your website.
Your hotel’s website conversion rate is critical in turning digital traffic into physical guests.How to Calculate Your Hotel Website’s Conversion Rate
To begin working out your current website conversion rates, you need to first figure out what it is you are measuring. Consider the key things you want your website users to do. For most hotel websites, this is fairly straightforward: make a room reservation.
But yours may vary. Some others we see include:
- Booking a table at the restaurant
- Purchasing a spa package
- Enquiring to reserve a venue for a corporate function, party or wedding
- Signing up to a yoga class
There really aren’t any limits, so long as it is technically able to be measured.
Ecommerce Tracking in Google Analytics
Most established hotels use a booking engine to show availability and pricing on certain dates. This system should allow you to track conversions through Google Analytics (if it doesn’t, it may be time to make a change). This type of tracking is called “Ecommerce Tracking“.
Wherever possible, you’ll want Ecommerce Tracking to be set up, as it gives you a wide range of helpful information, much of which can be used to improve a hotel’s conversion rate and the revenue that the website generates.
Ecommerce Tracking allows you to see:
- Number of bookings,
- Amount of revenue generated,
- Average order value,
- Sales performance by product,
- Sales performance by category, and of course the
- Ecommerce conversion rate.
Ecommerce Conversion Rate is the percentage of visits that result in an ecommerce transaction, and is a great proxy for the efficacy of your marketing and site design: is your marketing delivering an audience that is primed to buy, and is your site designed to make purchasing easy for those users?
So, as a formula, the ecommerce conversion rate is calculated using:
(Number of Sessions / Number of Transactions) x 100
Goal Tracking in Google Analytics
Some things, however, can’t be tracked to a specific payment on the website. That, and some hotels aren’t using an online booking engine, which is where things get a little trickier.
If your hotel uses contact forms or requests people to click an email link, this is for you. Consider the value of:
- A reservation request through the website that must be confirmed via email (no payment is taken on the website)
- An enquiry to reserve a venue for a function
- An expression of interest for a cooking class or meditation retreat
On face value, there’s no exchange of money, but all of these can (and should!) lead to a sale. This type of goal completion is something we often refer to as “lead generation”.
Goals in Google Analytics allow you to measure and report on these actions and, if it makes sense, you can also assign a dollar value to them. If you know the average sale price of say, a venue reservation for a function, and your sales team knows what percentage of leads they can convert to a sale, you have a ballpark value on what one of your leads is worth.
So in this case, you can calculate the goal conversion rate using the formula:
(Number of Sessions / Number of Goal Completions) x 100
Page vs Site
It’s worth noting here that you can look at your conversion rate from two different points of view, either at the individual page level, or the overall website.
Unless you are your hotel’s in-house conversion rate optimizer, I strongly suggest you look at the overall website conversion rate. Why is this?
Your website’s overall conversion rate gives you a metric for success of all of the effort put into your hotel’s website, such as:
- A great sales proposition
- Content marketing/blog posts
- Conversion rate optimization
- Improved web hosting
- Sales copy and messaging
- Search engine optimization
- Visual features
Though these are relevant at the page level, it’s unfair to expect a blog post to drive as many conversions as a booking page – but that doesn’t mean it hasn’t served a valuable purpose.
Typical Hotel Conversion Rates
With the calculations out of the way, let’s look at some typical hotel website conversion rates from a number of sources. Splitting this information specifically down to boutique hotels is challenging, as there often isn’t enough data available, so in most cases we’ll be referring to “travel and hospitality” conversion rates.
Average Hotel Ecommerce Conversion Rates
The best public data on hotel ecommerce conversions (hotel booking engine conversions) come from Wolfgang Digital’s ecommerce KPI benchmarks reports. Though not exclusively hotels, it’s as close as anyone has reported on to date. They state, “travel contributors are predominantly hotels with a small number of visitor centres/attractions.”
Though less specific to hotels, Statista offers us ecommerce conversion rates for the worldwide travel industry to help us round out 2015. Its data is split into regions and devices, but averaged out fits Wolfgang Digital’s research.
Average ecommerce conversions rates were:
2016: 2.04%
2015: 2.01%
2014: 1.56%
Travel & Hospitality Industry Goal Conversion Rates
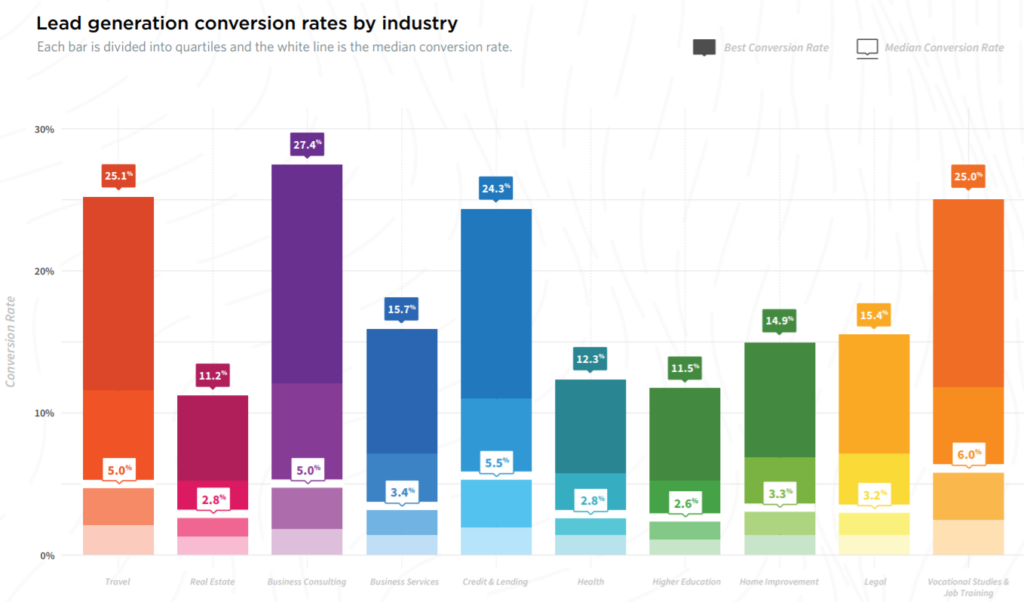
During the 2017 Call to Action Conference we picked up a copy of the March 2017 Conversion Benchmark Report by Unbounce. The report stated the median conversion rate for lead generation (goal completions) in the Travel industry was 5.0%. The very best pages were converting at 19.7% or higher, while the 25th percentile were converting at 2.1% or lower.
In the report, the Travel industry tied with Business Consulting and was only beaten by Credit & Lending and Vocational Studies & Job Training.
Not surprisingly, the research found even 1% of page copy that may remind a user of anger or fear can result in up to 25% lower conversion rates. There is no doubt a link between these feelings and concerns around terrorism in today’s world.
Non-Specific Travel & Hospitality Conversion Rates
Unfortunately we don’t always have the whole story. Some publicly claimed conversion rates aren’t specific to the type of conversion taking place, so while it’s helpful as a guide, it’s not something we can use as a true benchmark.
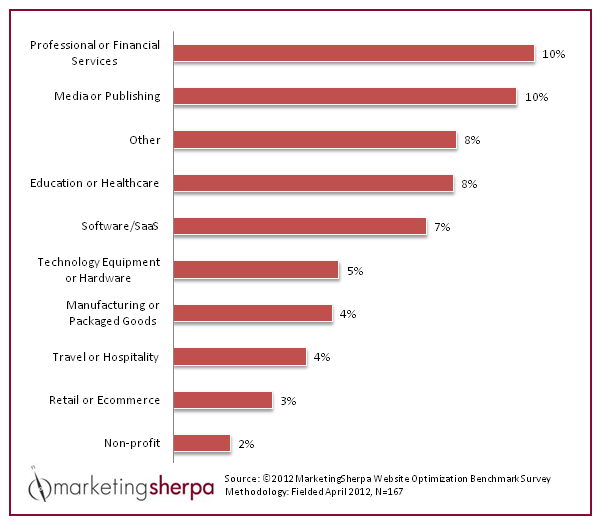
One theme I have seen over the years however, is the improvement among the travel industry. Marketing Sherpa’s Website Optimization Benchmark Survey from April 2012, shows Travel and Hospitality businesses averaging a 4.0% conversion rate – at the time, beaten by almost every other industry in the survey outside of retail and non-profits.
Historically, the travel industry wasn’t a strong performer when it came to website conversion rates, but times are certainly changing. From conversations we have had, higher advertising costs (Google Hotel Ads, paid social media campaigns and other forms of Pay-Per-Click) are encouraging hoteliers to look at how they can get better value out of their existing advertising costs, especially as many of these hotels are strapped for marketing budget as it is.
So in 2012, Travel and Hospitality was 3rd from the bottom for converting, and now in 2017, the industry is third from the top!
Travel Conversion Rates by Device
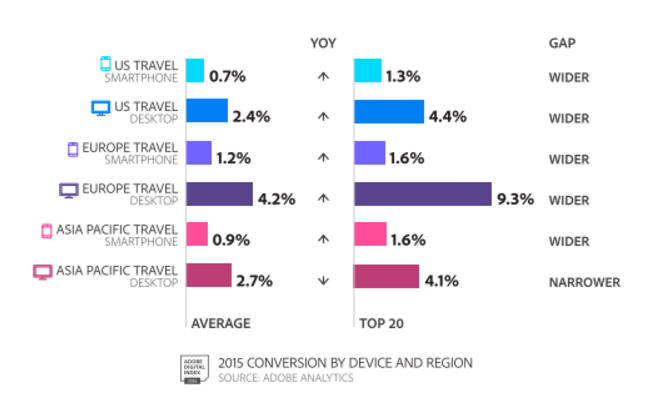
In the 2015 “Best of the Best” report by Adobe Digital Index, we saw a breakdown of conversions by device and region for the travel sector. Desktop conversions continued to be greater in all regions, but dominated in Europe.
In the recently released 2016 report, Adobe didn’t give us the exact same breakdown, but their different numbers were shown over the last 2 years…
| Average | Best of the Best | |
| 2015 Desktop Conversion | 1.5% | 3.1% |
| 2015 Mobile Conversion | 0.3% | 0.5% |
| 2016 Desktop Conversion | 1.8% | 3.5% |
| 2016 Mobile Conversion | 0.5% | 0.9% |
The story here is, while people such as myself are making a big deal about the mobile-friendliness of hotel websites, the industry as a whole is making great strides to improve conversions on desktop. Though I’m still banking on “mobile first” hotel websites as the long term winners, it’s clear that there’s still money to be made on desktop, especially in Europe.
So What’s a Typical Benchmark Hotel Conversion Rate?
When boutique hotels initially approach us to help with their digital marketing, we typically see a conversion rate between 0% and 2%. Of course, it is possible to see much higher conversion rates, and boutique hotels with unique features are well positioned to do so. The improvement of conversion rates is referred to as “conversion rate optimization”, or CRO.
My view is that few boutique hotels are seeing higher than a 2.25% site-wide ecommerce conversion rate, year round, unless they are pursuing direct sales through their website aggressively, and working with a CRO expert.
Improving your hotel’s SEO contributes to improved website conversion rates, which can be a win for your boutique hotel’s marketing.
If you need help fixing problems with your website’s SEO, we can help. Contact us today or check out our SEO maintenance package pricing.


